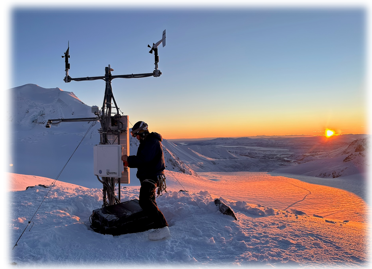
Station Technical Information
The AGW01 Winter Hazards station is solar-powered and uses equipment primarily from
Campbell Scientific (CS) to read sensors, store and process data, and provide telemetry. A
CR1000X data logger is used to measure and store data from a
variety of sensors and allow operator control of the station functions.
Data are automatically retrieved every hour from the station using a Windows version of
Loggernet Admin and posted online at least every 2-3 hours. This allows for a robust and
secure communication system. The near-real-time data display is achieved through RTMC-Pro.
Measurements and calculations are made every 5 seconds,
except for air temperature & relative humidity which are measured every 10 seconds, and snow depth wich is measured every 15 minutes.
Air Temperature and Relative Humidity are measured with a Campbell Scientific HygroVUE5
sensor mounted 6.5 feet (2 m) above ground level (AGL). Wind speed and direction are measured with RM Young 05103 and RM Young 05103-45
Wind Monitors mounted 10 feet (3 m) above ground level (AGL). Wind direction is measured in degrees from true north. Snow depth is measured with a Campbell Scientific
SnowVUE10 sensor. All data are provided in both metric and US Customary units.
Dew point is calculated from the HygroVUE5's air temperature and relative humidity measurements. Wind chill is calculated using wind speed from the RM Young 05103-45
and air temperature from the HygroVUE5 using the following National Weather Service (NWS) wind-chill equation,
where T=Air Temperature (°F) and V=Wind Speed (mph). The equation only applies if wind speed is >= 3 mph and air temperature
is <= 50 °F; otherwise, wind chill temperpature equals air temperature.
Wind Chill (°F) = 35.74 + 0.6215T - 35.75(V^0.16) + 0.4275T(V^0.16)
For additional information on wind chill effects, see the NWS wind-chill information page.
|